Why is insulin so expensive? Middlemen take half the profit
USC Schaeffer study tracks down the insulin pricing and distribution chain.
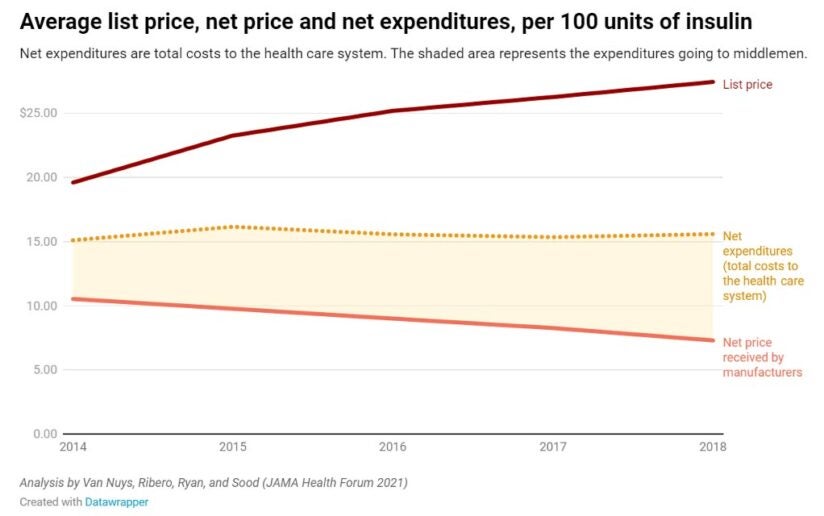
Despite being discovered nearly 100 years ago, insulin’s list price has been going up, not down, with trade secrets and other protections preventing researchers from pinpointing who is receiving profits from its sale. Meanwhile, the net price — what manufacturers receive after accounting for all discounts and payments to distribution system entities — has been falling. So, why aren’t patients seeing the savings?
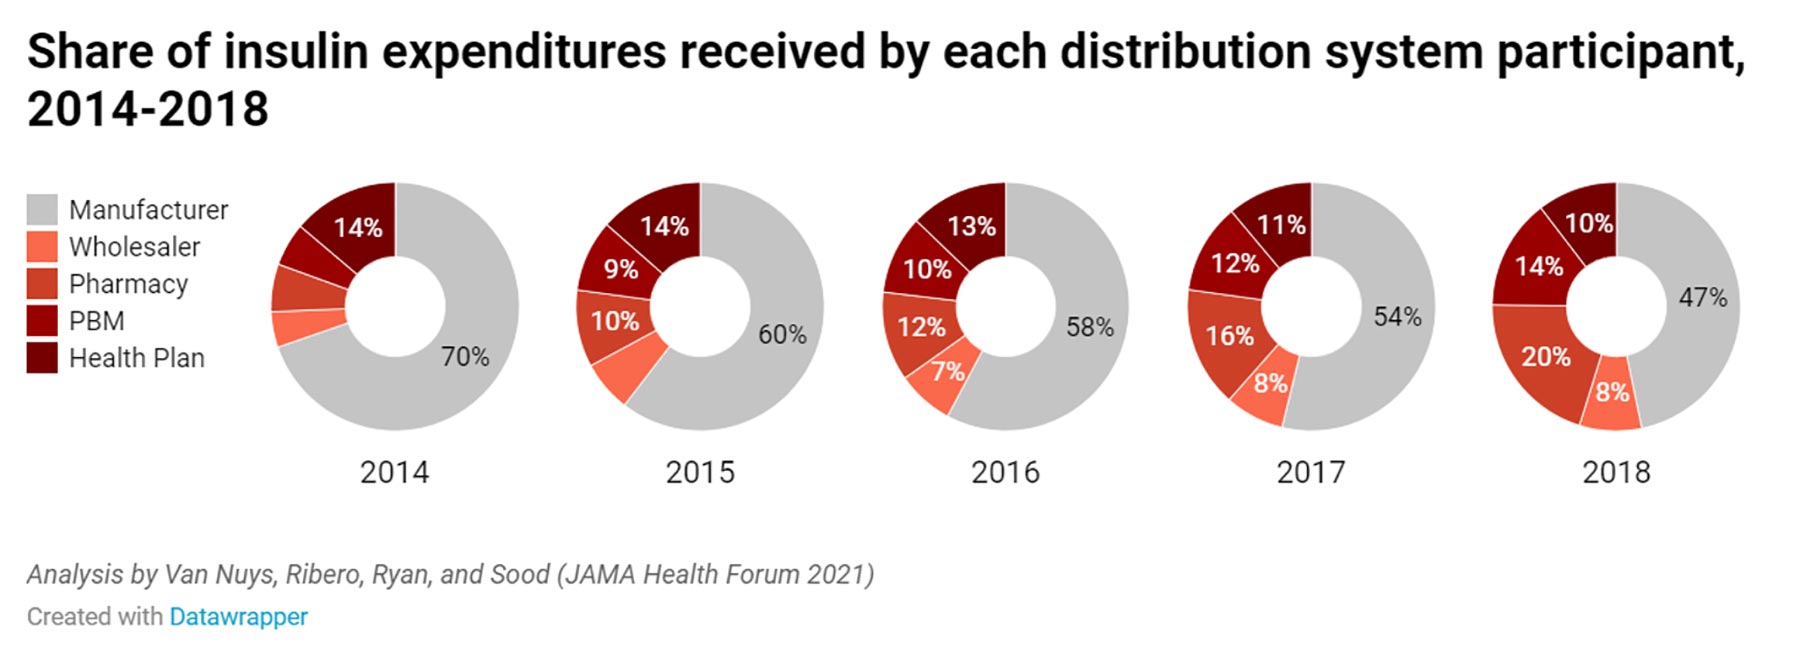
USC researchers analyzed the flow of money across all distribution system participants — manufacturers, wholesalers, pharmacies, pharmacy benefit managers (PBMs) and health plans. They found that middlemen in the distribution process now take home more than half — about 53% — of the net proceeds from the sale of insulin, up from 30% in 2014. Meanwhile the share going to manufacturers has decreased by a third.
This redistribution of profits has led net expenditures, or the total cost to the health care system, to remain relatively flat.
“Although manufacturers have been receiving less, the savings from manufacturers taking less are not flowing to patients,” said Karen Van Nuys, executive director of the Value of Life Sciences Innovation Project at USC Schaeffer Center for Health Policy & Economics. “Those savings are being captured by others in the distribution system, and any policy solution has to look at the entire supply chain.”

Web of insulin costs and distribution
To understand how money in the insulin distribution system has flowed over time, Van Nuys and colleagues Rocio Ribero, Martha Ryan and Neeraj Sood leveraged 15 different data sources to create a database of insulin expenditures between 2014-2018.
Of a hypothetical $100 spent on insulin, they find manufacturers accrued about $70 in 2014, falling to $47 in 2018. During this time, the share going to pharmacies increased from about $6 to $20, pharmacy benefit managers’ share increased from $6 to $14, and the share going to wholesalers increased from $5 to $8. Health plans saw their share decrease from $14 to $10 per $100 spent on insulin.

“Clearly all entities in the pharmaceutical distribution system profit from the sale of insulin,” said Sood, USC Schaeffer Center senior fellow. “But these data suggest increasing profits to intermediaries in the system are playing a key role in keeping net expenditures high.”
Building a unique data set of insulin expenses
Due to lack of transparency in the system, the researchers had to leverage several sources to develop a data set that enabled them to map expenditure flows at each step in the distribution system. Sources included data from Medicare and Medicaid, Securities and Exchange Commission filings as well as state-level audit reports that were the result of state drug pricing transparency laws passed in recent years.
“It is telling that we had to combine data from more than a dozen sources to understand expenditures on a single class of drug over a five-year period,” said Ribero, research scientist at the USC Schaeffer Center.
Regulation could limit insulin out-of-pocket expenses
About 9.1 million Americans with diabetes require insulin to effectively to manage their disease. Patients without insurance as well as those in high deductible health plans have increasingly felt the burden of high and rising list prices, sometimes with life ending consequences. Policymakers have taken note.
The Centers for Medicare & Medicaid Services recently introduced a model that would limit out-of-pocket expenses to $35 per 30-day insulin supply. While the researchers note that such steps would provide immediate financial relief to patients, they would not address the overall cost of insulin to the system, or the outsized market power and influence of middlemen.
Many intermediaries in the system operate in highly concentrated markets where they can influence prices, conclude the researchers. In 2018, the three largest pharmacy benefit managers accounted for more than 70% of all prescription claims, and the top three wholesalers accounted for 95% of distribution revenues.
“Clearly there are issues throughout the system,” said Van Nuys. “Policymakers should bring together all players in the distribution system, require a transparent accounting of financial flows at each step, and from there develop solutions that improve health and system-wide affordability.”
Support for this study was provided by the USC Schaeffer Center for Health Policy & Economics. The USC Schaeffer Center is supported by unrestricted donations from a variety of public and private entities, including manufacturers, pharmacies and health plans. These are listed in the center’s annual report, which can be found on the center’s website.


