
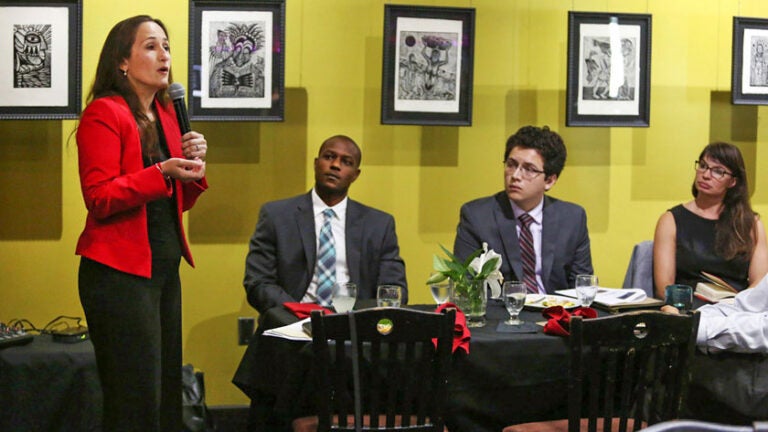
Mindy Romero, left, is the founder and director of the Center for Inclusive Democracy (CID) at the USC Price School of Public Policy. (Photo/Courtesy of Mindy Romero)
USC’s Center for Inclusive Democracy helps voters and officials during the 2020 election
Projects will help L.A. County tally votes and assist county election offices in 10 states with the placement of voting locations.
The Center for Inclusive Democracy at the USC Price School of Public Policy conducts a range of national and multistate research initiatives exploring voting behavior, civic engagement, electoral and economic research, the intersection of social justice and democracy, and more. USC News sat down with Mindy Romero, the center’s founder and director, to talk about new tools developed by the center to help voters and officials during the 2020 election.
Mindy Romero: We just announced a new ballot counting tool to give election officials, voting advocates and the general public up-to-date numbers of total votes cast in Los Angeles County by mail and in person leading up to the general election. We’re working with the secretary of state’s office to provide visualized data maps of total votes cast by registered voters by precinct and vote center locations.
Counts are updated twice daily, using VoteCal system data provided by the secretary of state’s office. The day before Election Day, we’ll update it four times a day. On Election Day, we’ll update it hourly. For elections officials, they will potentially be able to move staff around, depending on where the higher volume is, and reallocate to those areas that have not yet turned out in big numbers.
But aren’t people turning out like never before in this election?
There’s so much media coverage around the fact that with nearly a week before the election, there were more than 8 million ballots returned in California. These are huge early voting numbers. It’s blowing the doors off of anything we’ve seen in the past. It’s incredibly exciting, but when you look at that map for L.A. County, you’ll see that that’s not the case across the board; that’s not the case for every community.
We don’t want folks to think that these big numbers mean that there’s not as much outreach or voter education that needs to be done. The mapping tool helps educate and inform, and the numbers don’t lie. The map tells us a very quick, easy, clear visual story: There are many communities for which that the story of large turnout isn’t happening.
How does having that data mapped out make a difference?
This will help the registrar for their own outreach, staffing and resource allocation throughout the period of early voting and on Election Day, along with voting advocates ready to help communities that aren’t turning out. Knowing which communities have high or low voter participation leading up to the election can be critical to getting out the vote, especially in the midst of the current COVID-19 pandemic. The tool will allow communities across L.A. County the opportunity to better track early voting and plan last-minute outreach to voters planning to cast ballots in person at voting centers.
And this should go without saying, but this isn’t about helping one political party or another. It’s about helping to get a higher turnout, and a representative turnout, as much as possible in L.A. County.
What are some of the election changes that might require even more outreach to communities that historically don’t vote at high rates?
Many voters didn’t vote in the primary. That’s always the case, primaries having much lower turnout rates than general elections. Because of that, this is the first election in which a lot of regular voters will be showing up to vote. Some of them are going to be looking for their traditional polling place. They’re going to need to know that there have been changes.
This is the first year where L.A. has adopted the Voters Choice Act, which means voting moved from a traditional polling place model to a vote center model. Vote centers are less numerous. They’re open longer — up to 11 days — but there are fewer of them. In California, we went from 5,000 polling places to about 700 vote centers. Even though there are lots of conveniences to them — including that any voter can go to any vote center in L.A. County, they’re open longer and people can vote early — many voters haven’t gotten that message yet.
In fact, we’ve done survey research that shows people aren’t aware of the changes and they’re going to be expecting to vote in their normal precinct, which may no longer be there. You don’t want that to be a barrier when people are rushing on Election Day, maybe in between doing things with their kids or going to work.
Another change is that for the first time, due to the pandemic, everybody’s also getting a vote-by-mail ballot. It’s important that they understand what they can do with that: they can mail it or they can drop it off in a drop box or at a vote center. Or, they can still choose to vote in person.
We know a lot of communities need that extra support and mobilization to get to their voting centers. The mapping tool will help groups need to know where they can they can shift their own resources to help voters.
A few months ago, the Center for Inclusive Democracy launched a voting location siting tool that is available in 10 states. Tell me about it.
The tool, which is designed to provide assistance to county election offices in the placement of voting locations, was something we started in California for the 2018 election cycle with just five counties. We expanded it throughout California and then we expanded to Colorado, and we always had an eye to expand it to additional states.
We were fortunate to develop a partnership with the Democracy Fund to do a rapid expansion. I think it’s been recognized by many election officials — as well as voter advocacy groups and others — how helpful the tool could be in other states.
The tool is now available in 10 states that represent almost half of the U.S. population. It’s a user-friendly, interactive, web-based mapping system so county election officials can find specific locations for consideration, using local knowledge of their county’s needs. From there, they can figure out voting locations that would have the most success, that would be the most equitable and appropriate distribution of voting locations and would best serve voters in the county.
Given the challenges presented by the pandemic and the fact that nearly every elections office in the country was going to be dealing with some sort of reallocation of polling locations, we knew that this tool could be immediately helpful to that process.
The center moved to the USC Price School just over two years ago. What has been your experience at USC?
USC is a dynamic home and partnership, and it has been an incredible fit. Being at USC Price has allowed us to continue to grow our impact, and we’ve already had a lot of impact in the nearly 10 years that we’ve been a center.
Just during this election cycle, we can look to a number of examples where we’ve had an impact across the country on things like voting locations but also on voter outreach and education efforts. To provide another example: Our research on voting-by-mail has contributed to national conversations in an ongoing way during this entire election cycle. It has been cited in national news, and it’s been part of the dialogue and debate around helping to counter misinformation and provide some important facts to the conversation. We’re excited about what comes next.
What do you have planned?
We’re going to continue to expand our work, including expanding the reach of the voting location siting tool. We’ll do research on a number of topics related to our democratic system. And certainly, we’ll be conducting research not only in California but in other states as well, along with building our relationships, our scope and our impact.