The 2020 election will feature President Donald Trump versus Democratic nominee Joe Biden. (Photo/U.S. Department of State)
USC Dornsife launches 2020 election tracking poll; Biden leads by 11 points
The year’s version of USC’s groundbreaking Daybreak Poll will provide three ways to estimate how Americans may vote in the 2020 presidential election.
Two centers at the USC Dornsife College of Letters, Arts and Sciences have launched a daily nationwide poll to track Americans’ opinions about the presidential candidates.
USC researchers will base election forecasts on an updated version of methods used in their groundbreaking 2016 election poll, which tracked crucial inflection points in the election by following the same individuals over time. Data from the 2016 USC poll suggested late-breaking support among certain groups that contributed to Donald Trump’s surprise win in the electoral college.
“Our 2016 Daybreak poll was the USC debut of experimental polling methods pioneered by our team at Rand in 2012,” said Jill Darling, survey director of the 2020 Daybreak Poll, which is conducted by the USC Dornsife Center for Economic and Social Research.
“We adjusted our model for the 2018 election and had great success predicting the congressional outcome. This election cycle we’ll be using that model, and two additional methodologies, to track voter support for presidential candidates. We are also asking voters which party’s candidate they’ll vote for in congressional races.”
Results are based on repeated participation of eligible voters in USC’s Understanding America Study, a probability-based representative sample of U.S. households. The researchers expect that more than 6,000 voters from their panel will respond to the poll every two weeks, with shifts in the data reflecting changing opinions.
The first full release of findings from the poll will be in late August, in which researchers will examine the impact of the pandemic on voters and take a look at differences between voting blocs in 2016 and 2020. An early peek at preliminary data among roughly 1,500 respondents who participated from Aug. 11-16, using the poll’s signature probability method, finds Democratic nominee Joe Biden holding an 11 point lead over President Trump.
Three methods of estimating how America plans to vote
The poll is partially funded by the National Science Foundation through a collaboration between USC, the Santa Fe Institute and the Massachusetts Institute of Technology, led at USC by Wändi Bruine de Bruin, who is Provost Professor of Public Policy, Psychology and Behavioral Science at the USC Price School of Public Policy and USC Dornsife.
The partnership also includes the USC Center for Economic and Social Research and the USC Center for the Political Future. The latter is led by two of the nation’s most experienced political experts representing both sides of the political divide, Robert Shrum and Michael Murphy.
Our tracking will give us a real-time read on the shifting direction of the presidential and congressional races.
Robert Shrum
“This is the election of a lifetime,” said Shrum, co-director of the Center for the Political Future and Carmen H. and Louis Warschaw Chair in Practical Politics. “By polling thousands of people and polling every night, our tracking will give us a real-time read on the shifting direction of the presidential and congressional races.”
“This poll will add a lot to our understanding of the presidential race,” said Murphy, co-director of the Center for the Political Future. “Tracking data allows us not only to see what has been happening in the presidential race but also what might be coming next,”
The 2020 version of the USC Dornsife Daybreak Poll will use three ways of estimating how America plans to vote in the November election:
- The probability-based method used in 2016 and again in 2018.
- Asking participants how they expect people in their social circles and state will vote.
- Asking respondents whom they would vote for if the election were held today. This question includes third-party candidates for the Green and Libertarian parties and the option of saying that they remain undecided.
The three models will provide differently calculated estimates of where the national popular vote stands today. These results will be updated daily in the tracking poll graphs, along with the estimated vote in red, blue and swing states, in urban, rural and suburban areas of the country, and by political affiliation on the poll’s tracking website, which will be available online in the coming weeks.
First look at Daybreak Poll results
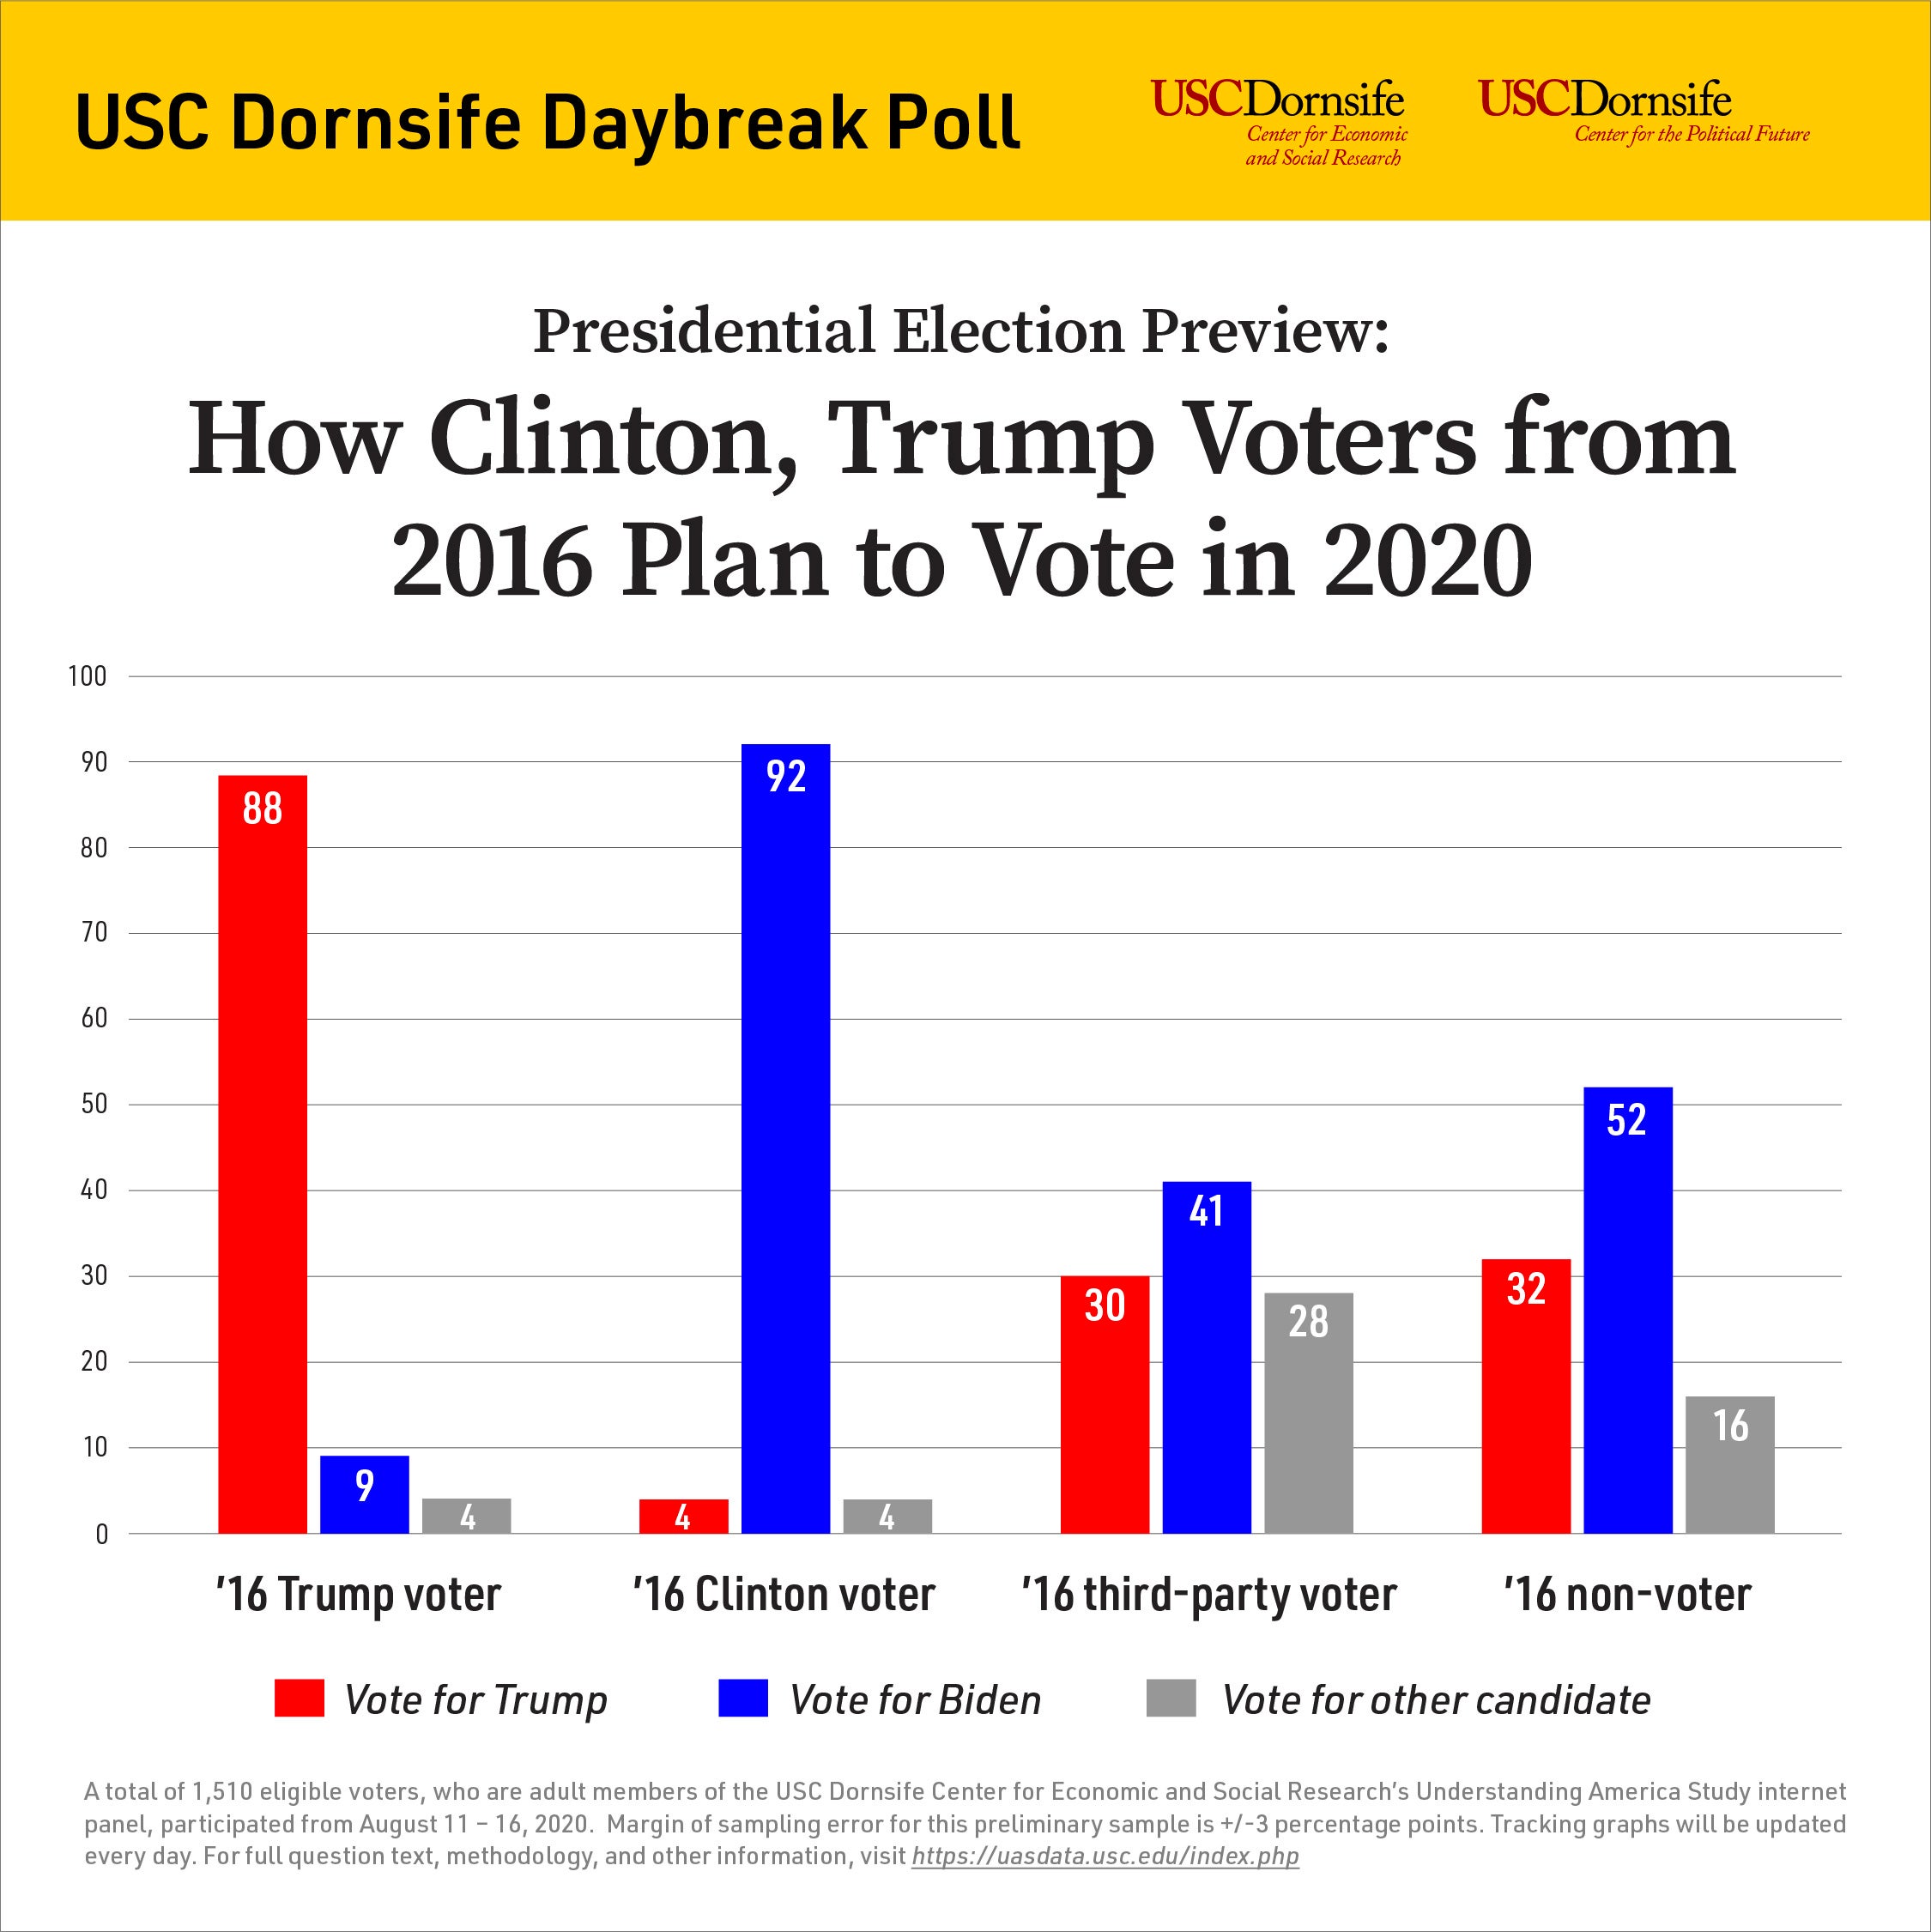
Because the panel of participants in the USC Dornsife tracking poll includes many who participated in the 2016 poll, researchers are able to compare their vote for president in 2016 to the candidate they’re supporting in 2020. Early results based on preliminary data, using the probability-based method, show:
- Biden holds an 11-point lead over Trump in the national popular vote.
- 88% of voters who backed Trump in 2016 support him today, while 92% of Democrat Hillary Clinton’s 2016 voters support Biden.
- Biden has an 11 percentage point edge among voters who backed third-party candidates in 2016, and a 20 percentage point edge among those who did not cast a vote four years ago because they were too young, prevented from voting or chose not to vote that year.
Notably, the researchers’ other models are showing somewhat different results. From the preliminary data, the traditional categorical model — asking voters whom they would vote for today — predicts a wider lead for Biden among registered voters, compared to the main probability model. However, when modeling the outcome using the social circle questions, Biden’s lead drops to single digits. The race draws even closer when forecasts are based on participants’ expectations about how people in their state will vote. (Overall margin of sampling error for findings based on the preliminary data is plus or minus 3 percentage points.)
The researchers will soon release findings in more detail from all three models after collecting a full wave of survey data.
How USC’s 2020 election poll is conducted
The poll, which is still growing as participants are recruited from the Understanding America Study, consists of about 6,000 eligible voters from across the country. Together, they constitute a representative sample of the U.S. population. Every day, roughly 430 of them are invited to answer four online questions in the Daybreak Poll. Each day just after midnight, researchers update the results, which are based on a week’s worth of responses.
Survey questions: Three of the four sets of questions represent different ways of estimating the national popular vote in the 2020 presidential election: probability polling, social circle polling, and traditional polling. Researchers are also polling the generic Congressional vote. For more information on survey questions and other aspects of the survey’s methodology, visit the 2020 election survey page.
To better understand influences on voters and their opinions, researchers will ask three sets of additional questions, late in August, September and October.
Daily tracking chart updates: At the end of each day, tracking graphs will be updated to reflect the latest findings. Each point on the tracking graph represents findings from the previous seven days, among about half of the full sample.
Estimates of the national popular vote: The poll’s large sample provides the ability to chart the changing mood of the national electorate as events unfold. Even so, it cannot predict state-level results. It is important to note that the poll is not aiming to estimate the outcome of the electoral college vote. In most elections, the popular vote and the electoral college vote lead to the same election outcome but in two elections within the last decade, including 2016, the outcomes were different.
A detailed methodology, topline results, and links to stories and graphics will be available on CESR’s 2020 Election page and the Center for Political Future’s Dornsife Poll site.


