How inclusive is the entertainment industry?
New USC Annenberg report card reveals percentages of underrepresented groups across film, television and digital content
A week ahead of the film industry’s biggest night of the year, a new study demonstrates how exclusive movies and television can be when it comes to women, people of color and the LGBT community.
The Comprehensive Annenberg Report on Diversity (CARD) is the first of its kind — an analysis and ranking of film, television and digital streaming services that catalogues speaking characters, people behind the camera, CEOs and executives.
Authored by Professor Stacy Smith and released by the Media, Diversity & Social Change (MDSC) Initiative at the USC Annenberg School for Communication and Journalism, the analysis found that only 28.3 percent of all speaking characters across 414 films, television and digital episodes in 2014-15 were from underrepresented racial/ethnic groups. This is 9.6 percent below the U.S. population norm of 37.9 percent.
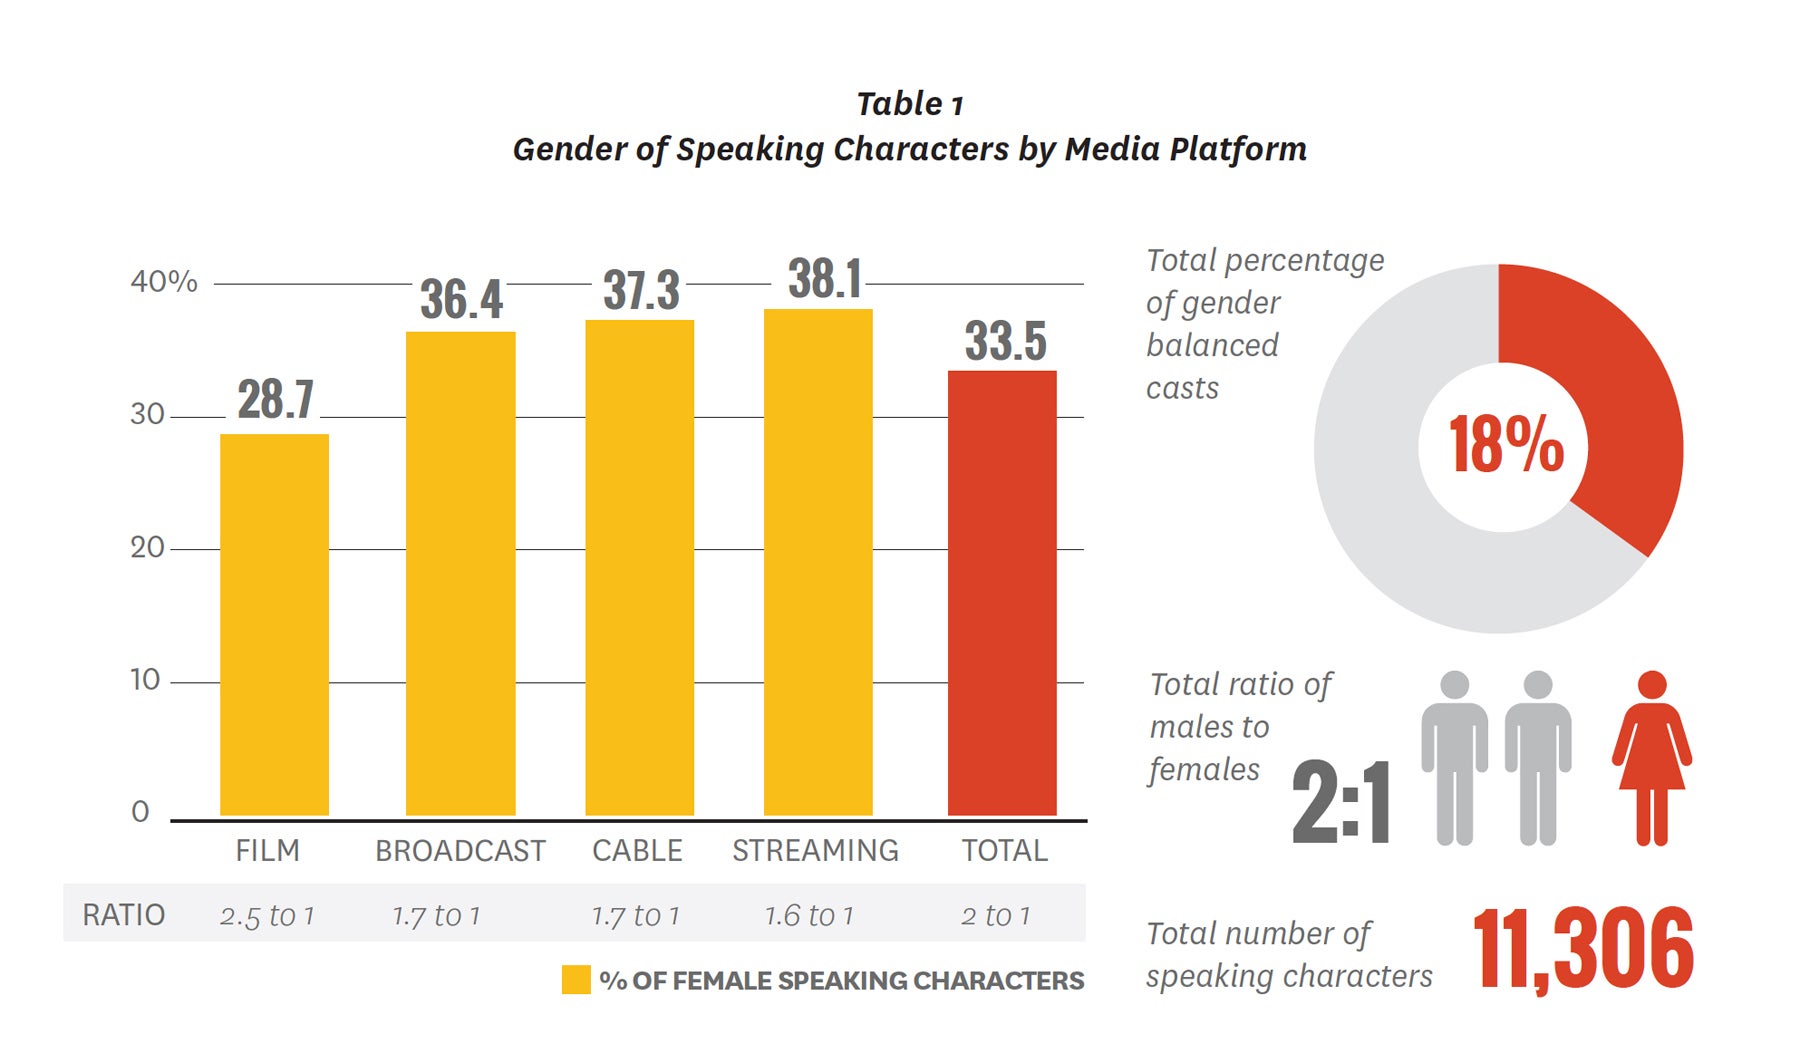
One-third (33.5 percent) of speaking characters were female. Behind the camera, a mere 15.2 percent of all directors and 28.9 percent of writers across film and every episode of television and digital series were female. Less than one-quarter (22.6 percent) of series creators were women across broadcast, cable and streaming content.
“This is no mere diversity problem. This is an inclusion crisis,” said Smith, founding director of the MDSC Initiative. “Over half of the content we examined features no Asian or Asian-American characters, and over 20 percent featured no African-American characters. It is clear that the ecosystem of entertainment is exclusionary.”
In-depth analysis
The report examined 109 films released by major studios and their art-house divisions in 2014. Additionally, 305 television and digital series across 31 networks and streaming services were analyzed. Smith and her team evaluated more than 11,000 speaking characters for gender, racial and ethnic representation, and LGBT status.
Moreover, in excess of 10,000 directors, writers and show creators, along with more than 1,500 executives at the different media companies studied were evaluated based on gender.
“No one has looked from CEO to every speaking character across film, television and digital content,” Smith said. “The results speak to the landscape of media and the erasure of different groups on screen and behind the camera.”
Ten companies responsible for media content were graded based on their on screen and behind-the-camera representation of women and people of color.
None of the six film distributors examined received a passing grade on the inclusion index. Of the 30 tests conducted, 24 or 80 percent yielded a “not inclusive” ranking. On a standard academic scale where 100 percent equals a perfect score, no film distributor earned a final inclusion grade above 25 percent across all tests.
Bright spots
The inclusion index for television and digital content revealed places for improvement and a few bright spots. Of the 50 tests conducted, seven fully inclusive and nine largely inclusive scores were awarded across the 10 companies evaluated on TV/digital content. The Walt Disney Co. and The CW Network were the strongest performers in television, while for streaming content, Hulu and Amazon tied.
The report also assessed the executive ranks of the 10 companies. Roughly one-fifth of all chief executives, corporate boards and executive management teams were made up of women. Near gender parity was reached in television at the executive vice president level. Across film, television and digital divisions, women were 46.7 percent of all senior vice president-level positions.
“A finding from our other studies regarding women in film is true of executive ranks as well. When power or influence increases, the percentage of females decreases,” said Katherine Pieper, USC Annenberg research scientist and one of the study’s authors.
“Organizations can take steps to solve inequality,” Marc Choueiti, one of the study authors, said. “Our hope is that companies begin to implement these solutions and that the numbers will improve.”
The inclusion index rates organizations on five indicators regarding their media content and behind-the-scenes hiring practices. Those metrics are the percentage of females and underrepresented racial/ethnic groups on screen and the percentage of women working as directors and writers. Film companies were also scored on their representation of LGBT characters, while television and digital companies were graded on the percentage of female series creators working behind the camera.
On Feb. 22, USC Annenberg will host an event to examine the results of CARD. Industry thought leaders will gather to discuss solutions to Hollywood’s diversity problem.


